Predictive Analytics for Good in Higher Education

How ReUp leverages predictive modeling to improve student outcomes.
Predictive modeling for good first appeared in Scotland over 200 years ago.
In fact, humans have been using probabilistic modeling to predict the future and inform how we act in the present since the birth of modern statistics in the mid-18th century. One of the earliest applications, a “Widows Fund,” was created by two Scottish ministers. For the price of a modest recurring contribution, the fund ensured that when a minister died, their family would receive an appropriate sum of money to live on. The math-savvy ministers’ ability to predict mortality rates, as well as financial needs over time, made possible this self-perpetuating model. The fund they created essentially became the world’s first life insurance company. (It remains an unparalleled success and is active to this day).
Since these remarkable origins, the use of statistical models in solving big problems has spread rapidly. Today, breakthroughs in machine learning and AI increasingly permeate our lives.
In the education sector, the growing adoption of data science means that there are now new ways to impact student outcomes. Predictive analytics is a powerful mechanism for change, and at ReUp, we have developed our own predictive analytics engine in order to better serve our partners and students alike.
Why attempt to predict the future?
The purpose of ReUp’s tech-enabled support is to find the millions of students who have stopped out of college and to help them navigate a path to degree completion. This makes student outreach absolutely essential to our work. So, if we identify 30,000 students that left one of our partner universities with some credit and no credential, how do we determine who to reach out to first? When to reach out? And exactly how to reach out, in order to make the most impact? This is where predictive analytics shine.
Within our platform, we have developed the ability to predict key student behaviors. This allows us to prioritize our outreach, personalize our support, and better forecast our results. It makes our entire operation more efficient and effective. It’s like flying a plane with the help of a radar system rather than just manually; we have an image of what’s coming and can adjust our path accordingly to maximize results.

What can we do to predict student success?
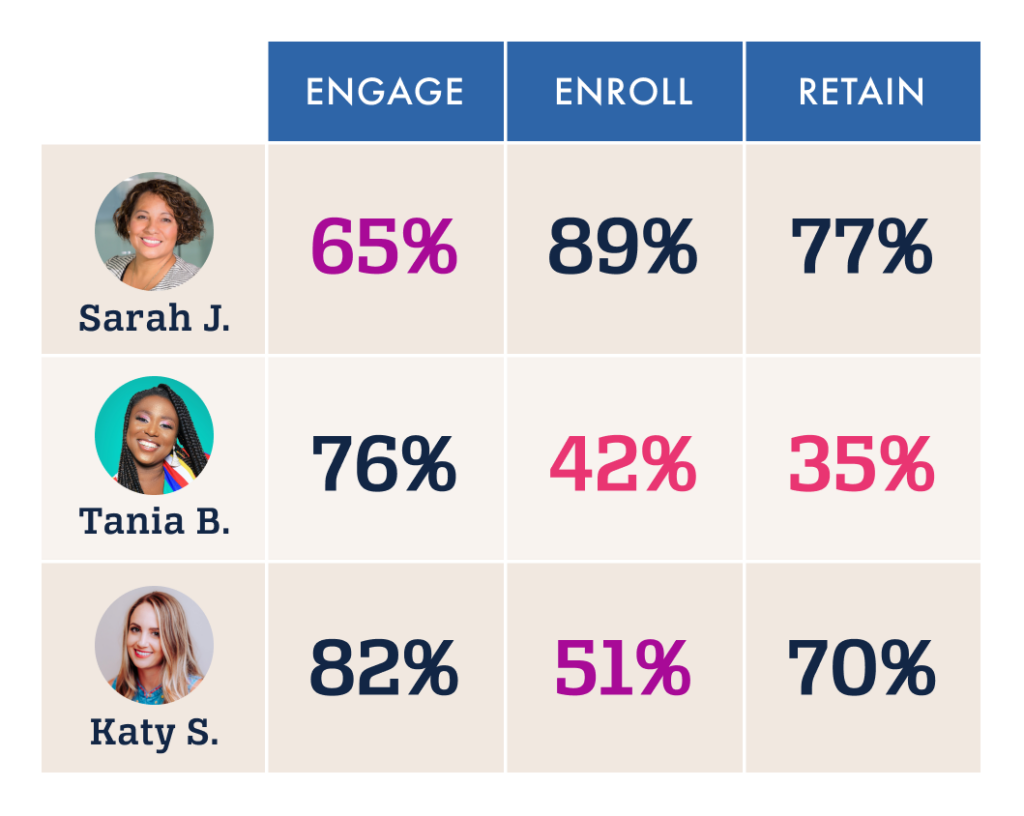
While there are dozens of student behaviors that can be predicted, it’s vital to identify the specific behaviors that are most consequential to success. Our strength-based approach involves creating and testing hypotheses for how to best impact each behavior through different aspects of our service. In the case of supporting stopout students, we’ve developed three primary models in order to understand each student’s:
- likelihood to engage in coaching;
- likelihood to re-enroll in school;
- likelihood to persist once back.

Together, these predictions tell us about patterns in student behavior across the population. This allows us to optimize every phase of the student lifecycle from first outreach to graduation.
How do we approach predicting success?
Before attempting to make high-quality predictions, the ideal starting point is high-quality historical data. By better understanding what happened in the past, we are better able to predict what may happen in the future. And while there are tactics that can be leveraged as a workaround for spotty data, nothing beats having a large volume of meticulously captured historicals.
ReUp serves the largest database of stopout students in the country, with millions of data points captured from our work with adult learners over the years. This growing corpus of data from past performance fuels our development process and accelerates our feedback loop.
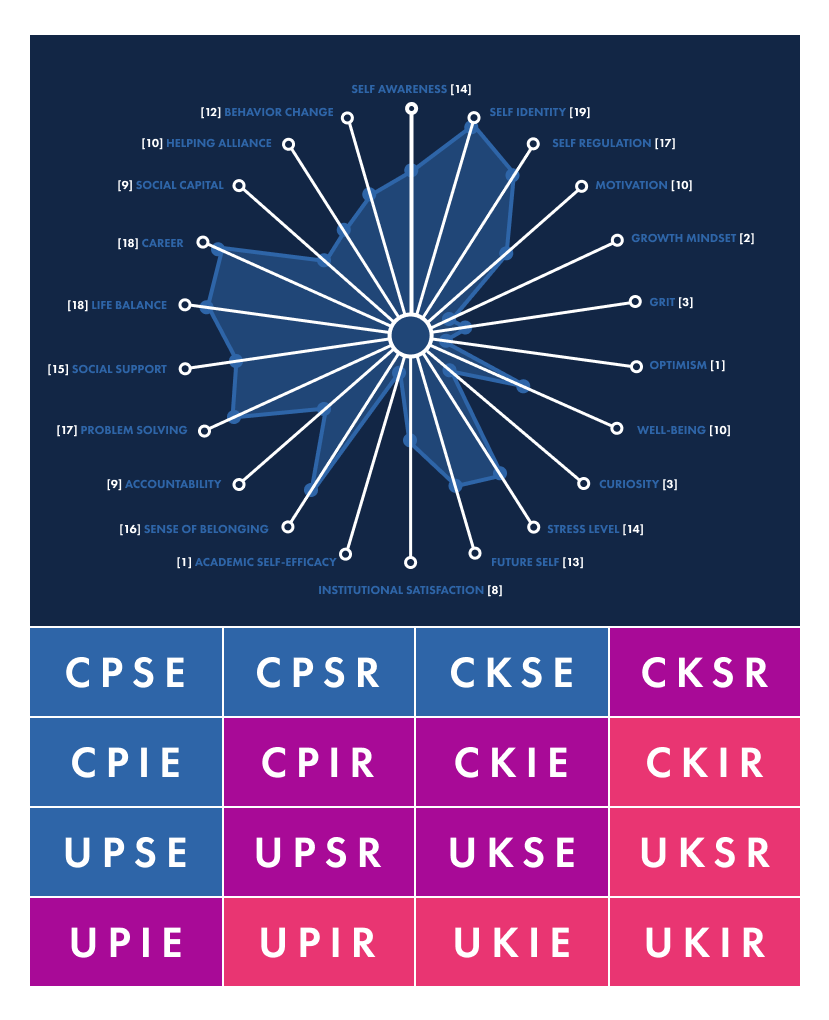
But what data are we talking about, exactly? We incorporate directory, academic, demographic, behavioral, and psychographic information—both structured and unstructured—into our model development. We obtain this data using our patented technologies and in collaboration with the partners we serve. In terms of algorithm selection and calibration, our platform allows us to test several modeling strategies simultaneously and deploy the optimal approach for engaging and motivating students.
Global vs. local data collection
Another typical shortcoming of developing predictive models comes from a lag in data collection. This lag occurs because it takes time to collect the minimum threshold of data needed to make accurate predictions. In the realm of student services, this often means that it takes at least 1-2 full academic terms to get enough varied student data for robust, reliable models. This is because as terms pass, there is more and more data on students based on who was outreached, engaged, enrolled, and retained, enabling higher predictive accuracy over time.
One of the benefits of working with our state and institution partners is that—instead of waiting up to two terms—ReUp has leveraged the entire dataset across our work to form a globalized set of models. This means that as we launch with new partners, we can make predictions and optimize our service before we’ve reached out to a single student. Then, as we complete our first and second terms, the global models gain additional training data, which further improves accuracy for all partners.
The combined predictive power of our global models has far outperformed those limited by the local maxima of a single institution or education provider.
Inclusion vs. exclusion in data collection practices
When it comes to how we use our generated predictions, our philosophy runs contrary to the norm. In the private sectors of many industries (such as healthcare and finance), predictive risk models are often used in a predatory or exclusionary way — to take advantage of certain groups while refusing service to others. These companies are incentivized to identify the most profitable opportunities no matter the downstream effects.
At ReUp, however, we leverage our predictions with the goal of facilitating inclusion — never exclusion. We are able to ensure this because the human impact of our work is in our DNA; we are only compensated when students re-enroll and as they progress through school.
To that end, we use predictive analytics to customize our interactions with all students. Here’s a practical example:

We find that students with a low likelihood of returning typically have more fundamental barriers in their way and the lowest overall readiness to return, so we set them on a longer journey to better understand what they value and what they may need before taking the next step.
Students with a medium likelihood of returning are a special group, as we’ve found this is where the human side of our coaching services can make all the difference in empowering a student to return and equipping them with the tools to succeed once back.
And students with a high likelihood of returning to school are typically more prepared to return with fewer obstacles in their way. We’re able to prioritize them in our outreach for the closest academic term and place them on a faster support track with increased automation and lower human touch.
It is through this inclusive and personalized approach that we’re able to support every student while optimizing our service as a whole.
Over time vs. one-time data collection
Timing can be hugely consequential when predicting human behavior. Each person has a unique set of factors at play in their lives that evolve and change over time, so when predictive models are only applied at a single point in time they typically underperform.
To account for this, ReUp’s platform incorporates time itself as a variable in our models so that the predictions we make are as dynamic as people’s lives. This means that each day, all the students we serve receive a new set of predictions based on the latest data we have available. Thus, the actions we take to support students are up-to-date, which makes them far more accurate, useful, and effective.
Tuning data collection for equity
When working with underserved populations, it is especially important to understand the ethical ramifications of technology usage in service delivery. In ReUp’s case, we treat this responsibility with the utmost care by ensuring that every model we develop is assessed for evidence of bias or discrimination and tuned accordingly.
Our guiding principle here is to accelerate equity, not replicate inequity. Nationally, we know that 40% of Black adults and 31% of Latino adults have earned an associate degree or higher, compared to 56% of white adults, according to reports. Because of these equity gaps, we favor algorithms that are highly interpretable, rather than leveraging black-box methods that may be highly accurate but can’t be fully explained. We are unwilling to sacrifice our understanding of the individual for the potential of a marginal gain in performance. In other words, we know exactly which data points go into our models, how each is used to generate a prediction, and what that means for specific student groups. This transparent understanding allows us to better navigate our support of each student while reducing inequity.
(Note: our entire platform is both NIST and FERPA compliant to ensure that all student data is protected and secure.)
Learn more about ReUp’s technology
Our national dataset on stopout students has empowered us to re-enroll over 16,000 students and recapture over $55 million in tuition revenue for our state and institution partners. And as we continue to support adult learners and understand their needs, objectives, and motivations, we are only gaining a more comprehensive and predictive picture of each student.
As we look toward the future, we will test and refine our platform, predict additional behaviors, and dive deeper into the world of personalization. Through both innovation and iteration, we hope to further unify the art of coaching with data science to create a more dynamic and equitable ecosystem in which all learners have access to the support they need to pursue their goals and thrive.
To learn more about our data, technology, and Success Coaching can lead to success for our students and university partners, read about our solutions here.
Editor’s note: This post was originally published in August 2019 and has been updated for accuracy and comprehensiveness.
Let’s start the conversation
Schedule a call with a ReUp team member to learn more about what a ReUp partnership could do for your institution.